01
Delivery time is too long, although every single station works quickly. Nobody can say where the weeks in between go.

value stream mapping
A value stream map shows on a single sheet what nobody else in your plant sees as a whole: the path of an order from the customer's request to delivery, with all inventories, waiting times and information flows. I carry out the analysis with your team on site, in the plant and in the office, and derive from it a value stream design that measurably shortens lead time.
Almost every plant knows its process times.
The value stream comprises all activities a product or service passes through from raw material to the customer, value-adding and non-value-adding alike. Value stream mapping records this flow in a standardised set of symbols: process steps with cycle time, changeover time and availability, inventories between the steps, material and information flows, and at the bottom the timeline that sets process time against lead time.
This timeline is the moment when the room goes quiet. When a process time of four hours stands against a lead time of 18 days, it is clear where the lever lies. Not at the machine, but in between.
Value stream design is the second step: the target state. It defines where flow is possible, where supermarkets and Kanban limit inventory, which pacemaker process sets the takt and how information will flow in future. The measures emerge from the difference between current and target state, prioritised by their effect on lead time.


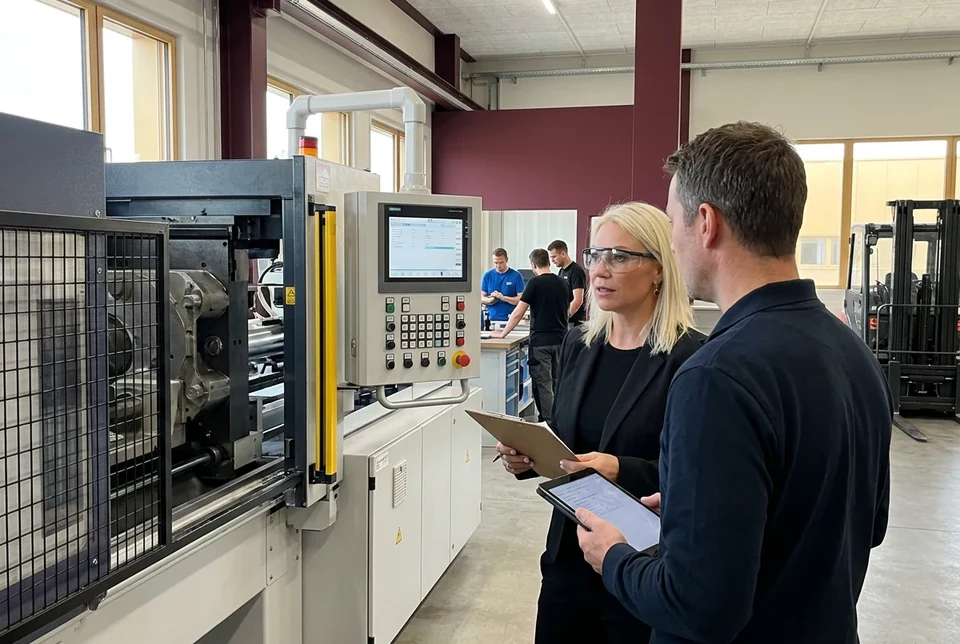
You do not do a value stream analysis at a desk from ERP data. You walk the path of the product, with a stopwatch, a clipboard and the people who work there.
Not the whole plant at once, but the family with the largest volume or the greatest pain.
One to two days on site with a mixed team from production, planning, logistics and order processing. We walk upstream from dispatch to goods receipt, count inventories, measure times, record information flows.
Where does it pile up, where is there waiting, where is something checked twice, where is information missing?
Calculate customer takt, define flow and pull, define the pacemaker, set target inventories.
Every measure with an owner, a deadline, the expected effect on lead time and inventory, and where useful a cost-benefit assessment.
The result fits on a wall and into a presentation for senior management:
Current-state value stream of your product family with process time, lead time, inventories and information flows.
Customer takt and comparison with the cycle times of every station, including proof of the bottleneck.
Future-state value stream (value stream design) with flow, pull loops and pacemaker.
Prioritised action plan with owners, deadlines and expected effect.
A value stream mapping example and template from your own plant, which your team uses to map further families itself.
On request: support during implementation until the new inventories and lead times are stable.
Intro call
You describe your starting point, I tell you openly whether and how I can help.

Frequently asked questions
Value stream mapping is a lean method that maps the complete material and information flow of a product from supplier to customer in a standardised chart. It shows every process step with its key figures, the inventories in between and the control information. At the bottom is the timeline that sets process time against lead time. This makes visible where an order is actually being worked on and where it merely sits. The analysis is the basis for value stream design, the planned target state.
A value stream is the totality of all steps needed to bring a product or service from order to delivery. It includes value-adding steps such as machining or assembly, but also non-value-adding ones such as transporting, storing, inspecting and waiting. The information flow is part of it too: how does the order get to the machine, who plans, who reports back? Anyone who knows the value stream understands why an order takes three weeks even though it is manufactured in four hours.
First you choose a product family, meaning products with a similar process route. Then you walk the route on site, ideally upstream from dispatch back to goods receipt. At every station you record cycle time, changeover time, availability, batch size and number of employees; between the stations you count the inventories. You also draw in how information flows: customer call-off, production schedule, supplier order. Finally you convert the inventories into days and enter the timeline. Important: with pencil and paper and as a team, not from the ERP system.
Yes. I work with the established symbols: process boxes with a data box, triangles for inventories, arrows for push and pull flow, lightning arrows for electronic information and the timeline along the bottom edge. In the workshop you receive this template as a paper format and as a digital file, and we fill it with your own value stream. That is the best example there is: your hall, your figures. Generic examples from textbooks help you understand the symbols, but not decide what you need to change.
Not by making machines faster, but by eliminating idle times. The most effective levers are smaller batch sizes, so that orders do not wait for whole batches to be completed; shorter changeover times, so that small batches are economical; pull control with limited inventories instead of push according to plan; and the elimination of queries and approval loops in the office. Value stream mapping shows which of these levers brings the most in your case. In my projects, reductions of up to 70 percent were possible this way.
Takt time, or more precisely customer takt, is the available production time divided by customer demand in the same period. If 420 minutes are available per shift and the customer needs 210 parts, the takt is two minutes per part. Customer takt is the reference for every station: if its cycle time is longer, it is the bottleneck; if it is significantly shorter, overproduction results. In value stream design I align lines and cells to this takt instead of to maximum machine utilisation.
I bill on a time-and-materials basis, based on a day rate, or as a fixed-scope package. A value stream mapping workshop usually comprises one preparation day, two to three days on site with your team and the elaboration of the future-state value stream and action plan. We clarify the exact scope and the proposal in a no-obligation initial consultation. I give you concrete figures there, not on the website, because they depend on the scope of your value stream.
Yes, and there it is often particularly productive. In administration, value streams consist of handovers between people and systems: order entry, technical clarification, costing, approval, ordering. Instead of inventories I count open transactions in in-trays and filing, instead of changeover time the time it takes to get back into a task when switching between tasks. Typical findings are media discontinuities, duplicate data entry and approval loops that cost days. As a certified Lean Admin Expert, I map these value streams with the same systematic approach as in the hall.
45 minutes, no obligation. Bring your lead time, I bring the questions.